Data-driven decisions, workflow automation, more time for what matters.

/N3U is a data and automation studio. We do three things: workflow automation that takes repetitive work off your team, data analytics that turns your day-to-day numbers into decisions you can defend, and research tools that let researchers pressure-test whether a finding actually holds. All of it built to the standard we learned running operations at the Olympics, Regional Games, and World Championships.

Get in touch See our work

Three disciplines. One studio.

Whether you're running a business or running a study, the problem is the same: too much manual work standing between you and a decision you can trust. Here's how we close that gap.

From insight to automation — how we work with you

Two kinds of clients, one method: understand the workflow or the study design first, then build the system that makes the right decision the default — not the exception.

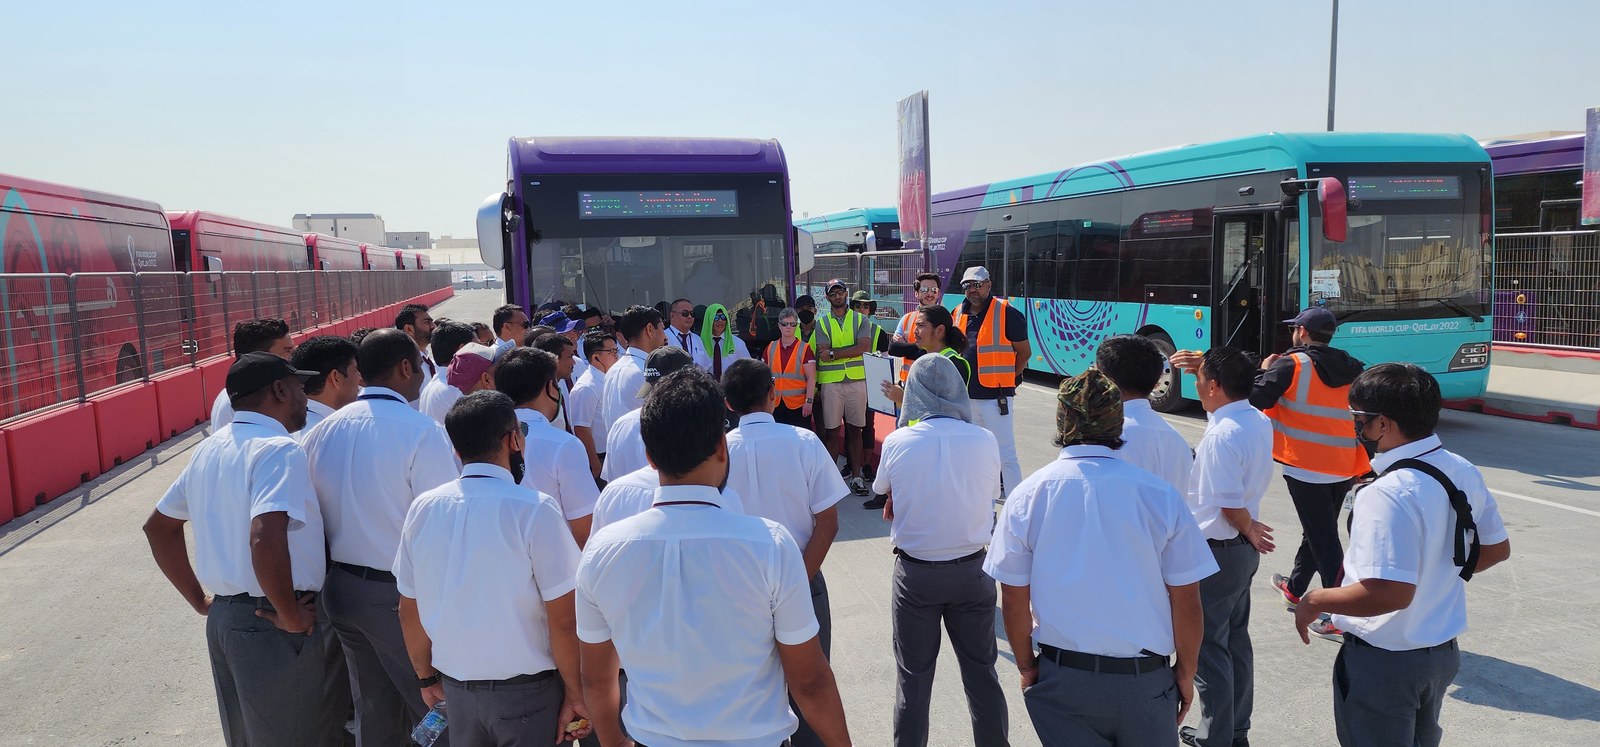
Team briefing at FIFA World Cup 2022
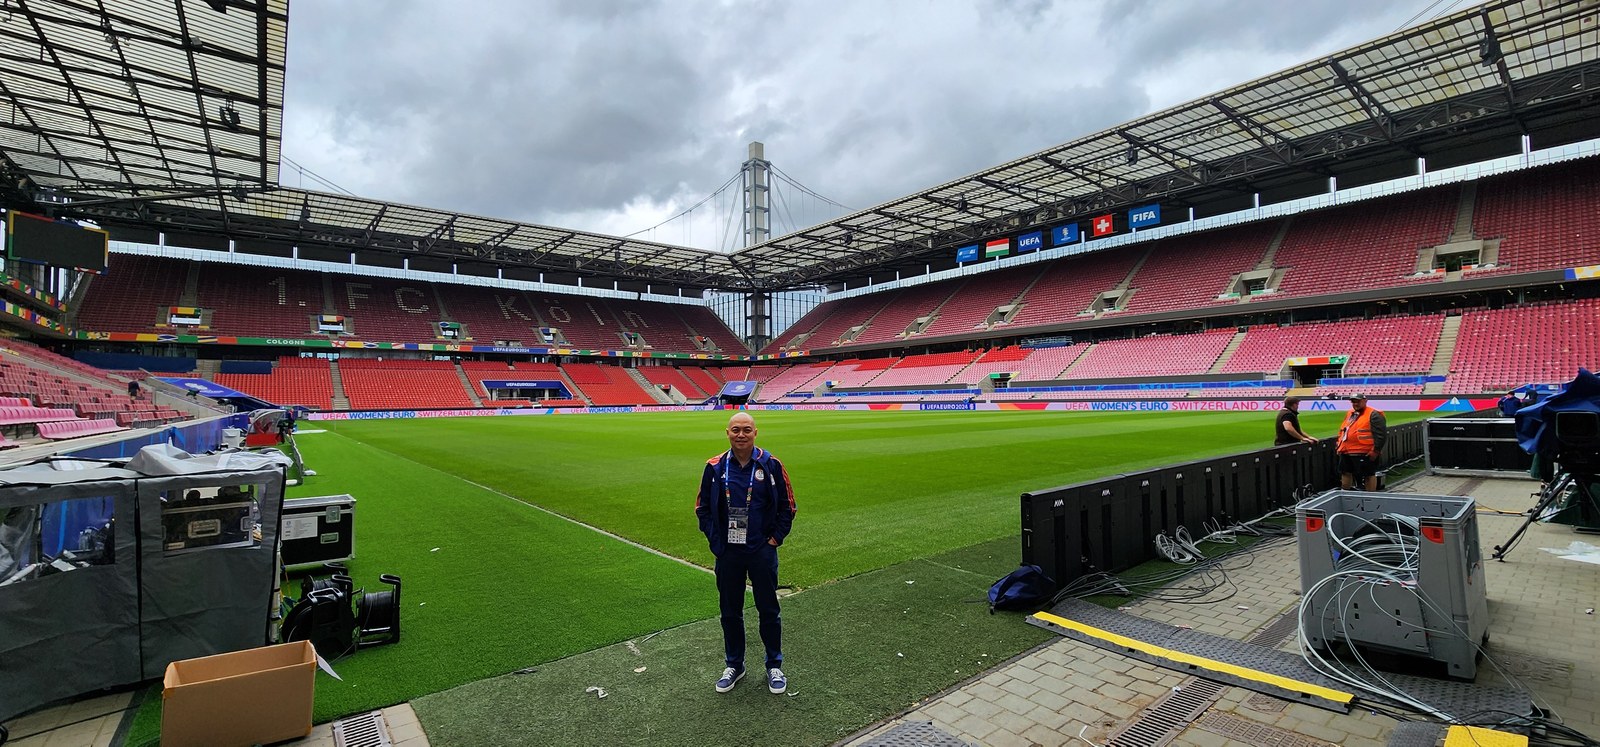
On the pitch at Cologne Stadium, Euro 2024
On the pitch at Cologne Stadium, UEFA Euro 2024

For Businesses

AI Workflow Audit

A structured diagnostic of your current operations, with a prioritised roadmap and projected savings.

  • Written report + presentation
  • Covers up to 5 core workflows
  • Tool stack assessment
  • Typically 5–10 business days

Workflow Build & Deploy

Full design, build, and deployment of your approved automation workflows.

  • End-to-end build to go-live
  • Integration with existing tools
  • QA testing & documentation
  • Team handover session

AI Tool Stack Consulting

Vendor-neutral guidance on which AI tools fit your business, budget, and capacity.

  • CRM, marketing, ops & finance tooling
  • Comparison matrix & recommendation
  • Pilot plan for shortlisted tools
  • 30-day follow-up review

Monthly AI Retainer

Ongoing partnership for businesses that want to keep evolving.

  • Fixed monthly engagement
  • Minimum 3-month commitment
  • Priority response SLA
  • Monthly performance review

For Researchers

Robustness & Reproducibility Analysis

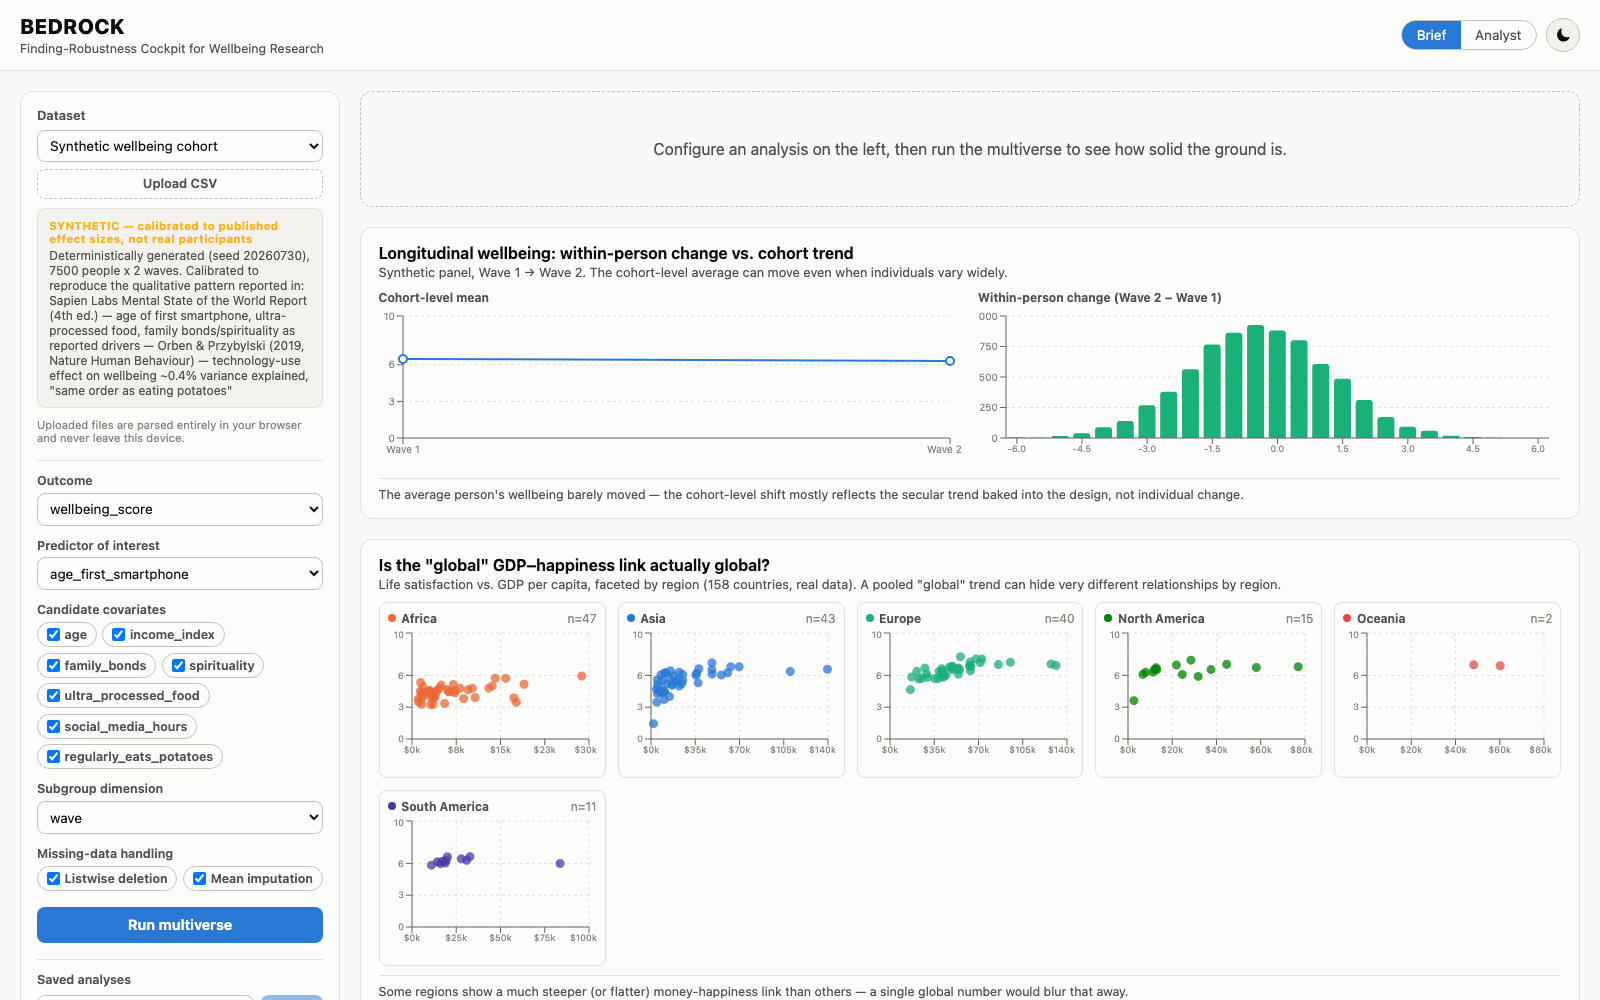
Specification-curve and multiverse-style testing that shows how fragile — or solid — a finding really is across reasonable analyst choices.

  • Multiverse / specification-curve analysis
  • Sensitivity & missing-data testing
  • p-curve and publication-bias checks
  • Written findings-robustness report

Research Data Pipelines & Instrumentation

Custom tooling for collecting, cleaning, and structuring research data — built around your study design, not a generic template.

  • Data collection & intake instruments
  • Cleaning & validation pipelines
  • Longitudinal / panel data handling
  • Privacy-aware, on-device processing where possible

Analysis Dashboards for Mixed Audiences

One dashboard, two readings — a rigorous analyst view and a plain-language brief for funders, policymakers, or the public.

  • Analyst & brief display modes
  • Interactive charts, not static PDFs
  • Built for conference & funder presentation
  • Deployed as a live, linkable tool

Collaboration & Grant-Support Engagements

Ongoing technical partnership for research groups and funders who need evidence quality checked as the work evolves.

  • Embedded technical collaborator role
  • Grant & proposal data-methods support
  • Fixed engagement or ongoing retainer
  • Works alongside your existing team
Built by /N3U

Live tools — click through to try them

Everything below is a real, working product, not a mockup. Business tools first, research tools second.

Research Tools

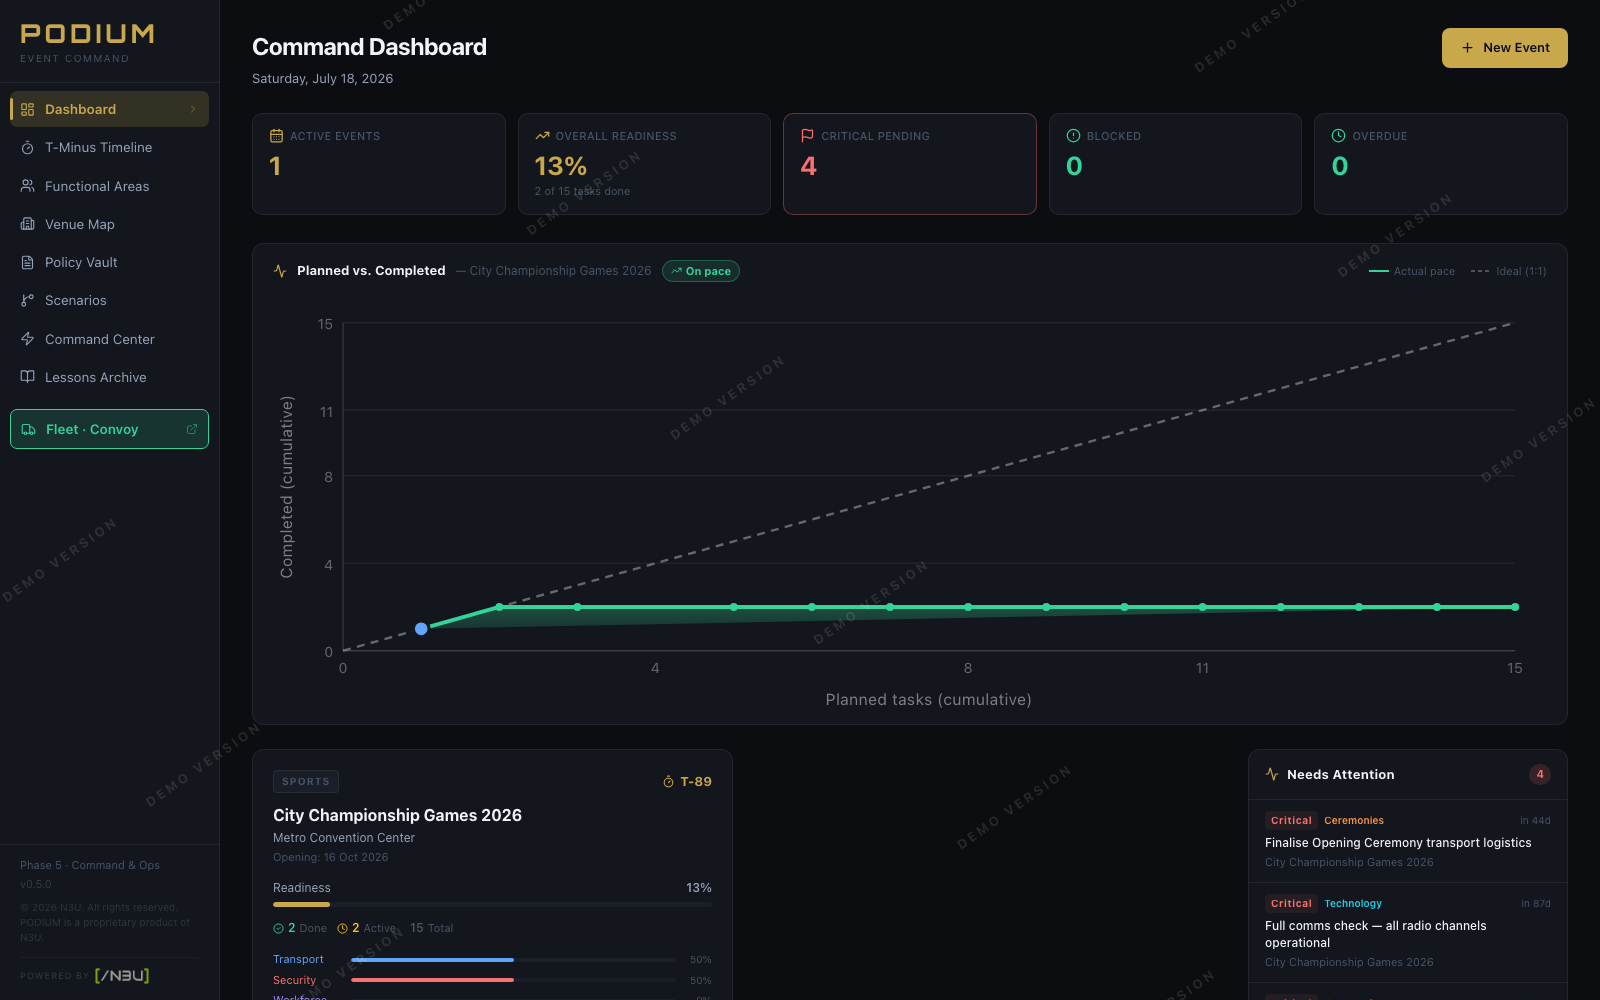
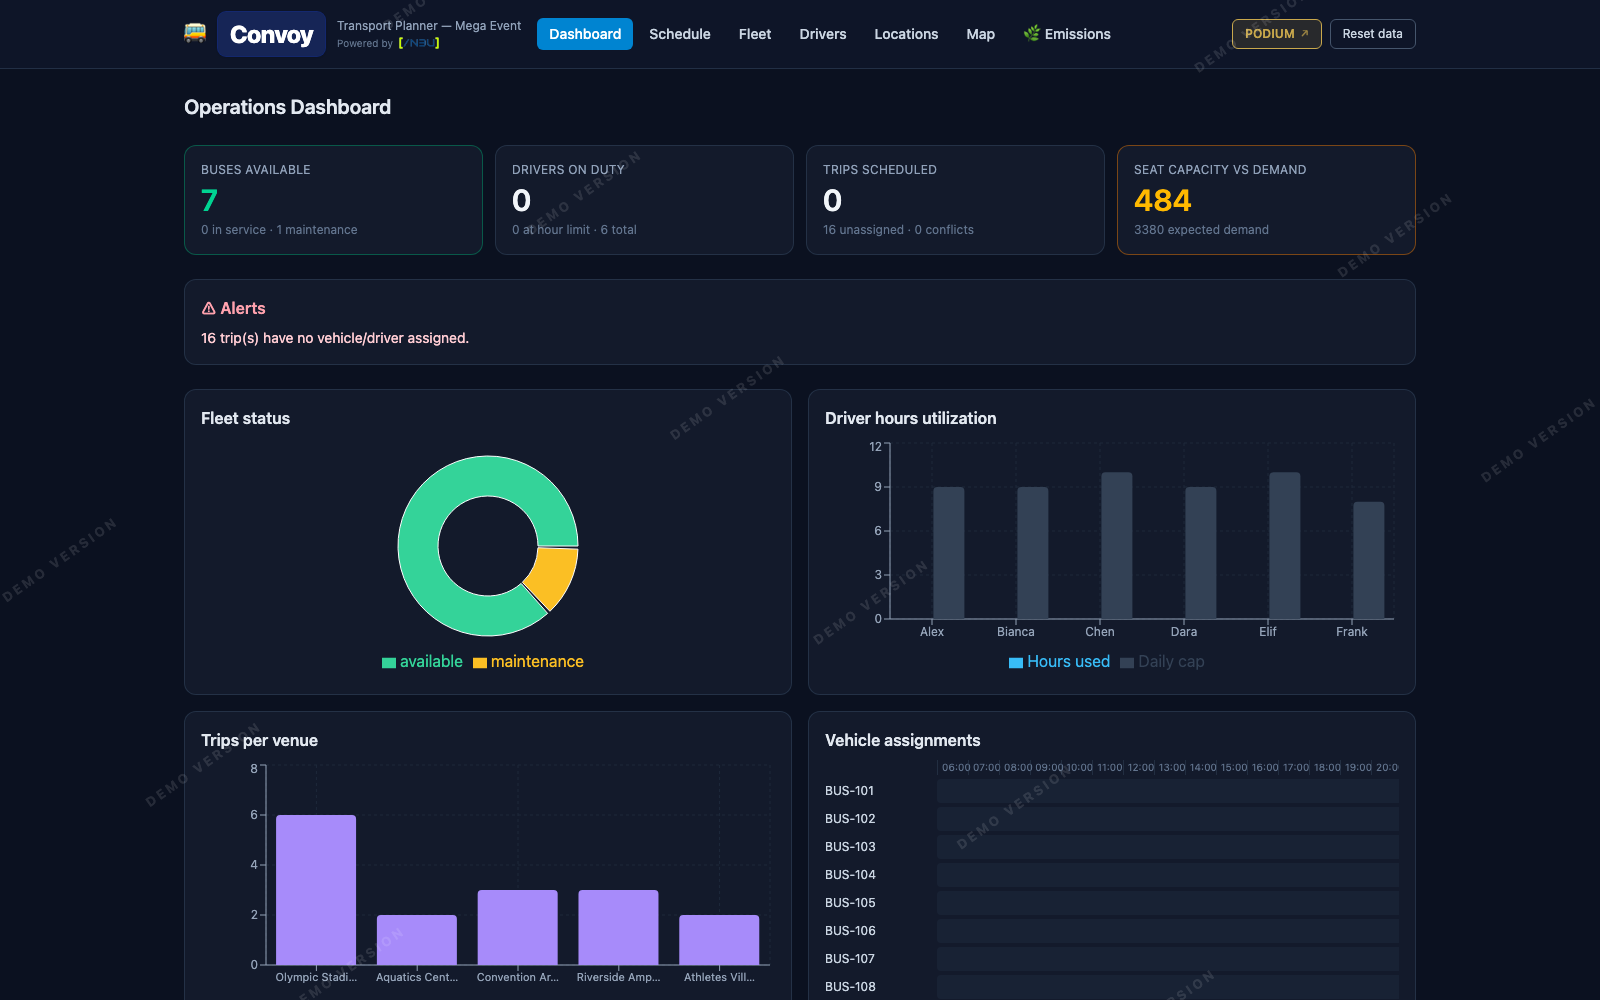
Automation isn't just for major events — it works just as hard for small businesses, government agencies, and research teams

The same workflow thinking that kept championship-scale operations running smoothly applies directly to the day-to-day headaches of running a small shop, a classroom, or a research study. Here's what we typically resolve:

Coffee Shops

From order chaos to a single till

  • Slow, error-prone manual order-takingTile-based POS with cash/GCash/card tender and instant change calc
  • No visibility into stock until it runs outLive inventory tracking with low-stock alerts and CSV import/export
  • Advance orders and reservations tracked on paper or chatBuilt-in advance-order and table reservation system with deposit handling
  • Owner can't tell which drinks or days actually make moneyDashboard with sales stats, top sellers, and category breakdowns
Try Kape POS demo →
Laundry Shops

From a whiteboard of machines to real-time status

  • No way to tell which washers/dryers are free without walking overLive machine status board with cycle timers that survive reloads
  • Walk-in and drop-off pricing calculated by handAutomatic per-load and per-kilo pricing with a built-in POS
  • Supplies (soap, fabcon, bleach) run out unexpectedlyInventory auto-deducted per order the moment a wash cycle starts
  • Pick-up items released before payment, causing lossesPay-on-pickup enforcement that blocks release until settled
Try SudsHub Laundry demo →
Clothing & RTW Shops

From a notebook ledger to real margins

  • Sales, cost, and stock tracked in separate notebooks or spreadsheetsOne system linking every sale to inventory in real time
  • No clear read on actual profit after rent, salaries, and buying tripsAutomated net profit calculation across COGS, overhead, and withholdings
  • Pricing set inconsistently item to itemStandardised markup formula applied automatically at entry
  • Stock-outs discovered only when a customer asksLow-stock alerts surfaced directly on the inventory dashboard
Try Shop Manager demo →
Teachers & Tutors

From after-hours grading to time back in your day

  • Attendance and grades tracked across loose spreadsheetsA single class record for attendance, scores, and progress
  • Parent updates sent one-by-one, manually, after hoursTemplated, scheduled updates sent automatically to the right parents
  • Lesson materials and schedules scattered across chats and foldersOne organised workspace for materials, schedules, and reminders
  • Repetitive admin eating into actual teaching prep timeRoutine class-admin tasks automated so prep time goes to lesson quality
Try Guro App demo →
Government Agencies

From scattered terminal ops to one command view

  • Parking, ground transport, and facility issues tracked in separate silosOne platform covering terminal ops, parking, ground transport, and facilities
  • No real-time read on chokepoint wait times during peak trafficLive wait-time logging so bottlenecks are visible as they happen
  • Facility issues reported informally, with no SLA trackingFacility/incident reports logged with SLA hours attached
  • Client satisfaction surveys collected on paper, hard to compileBuilt-in ARTA CSM survey capture, ready for reporting

Pilot programs available for a single office or facility before any wider rollout. Systems are built with Data Privacy Act (RA 10173) compliance in mind — no client data leaves your control.

Try BCD Gateway demo →
Doctor's Clinics

From a full waiting room to a full schedule

  • Appointments booked by phone, double-booked by accidentAutomated appointment scheduling with conflict prevention
  • Patients forget appointments, leaving empty slotsAutomatic reminders sent ahead of each booking
  • Front desk buried in rescheduling calls during peak hoursSelf-service booking and rescheduling that runs without staff intervention
  • No clear view of the day's patient flow until it's already chaoticA single schedule view showing the full day at a glance
Try Clinic Scheduler demo →
Researchers

From an unreplicable finding to one you can defend

  • A result holds under one set of analyst choices but no one's checked the othersSpecification-curve and multiverse testing shows how the finding holds up across reasonable choices
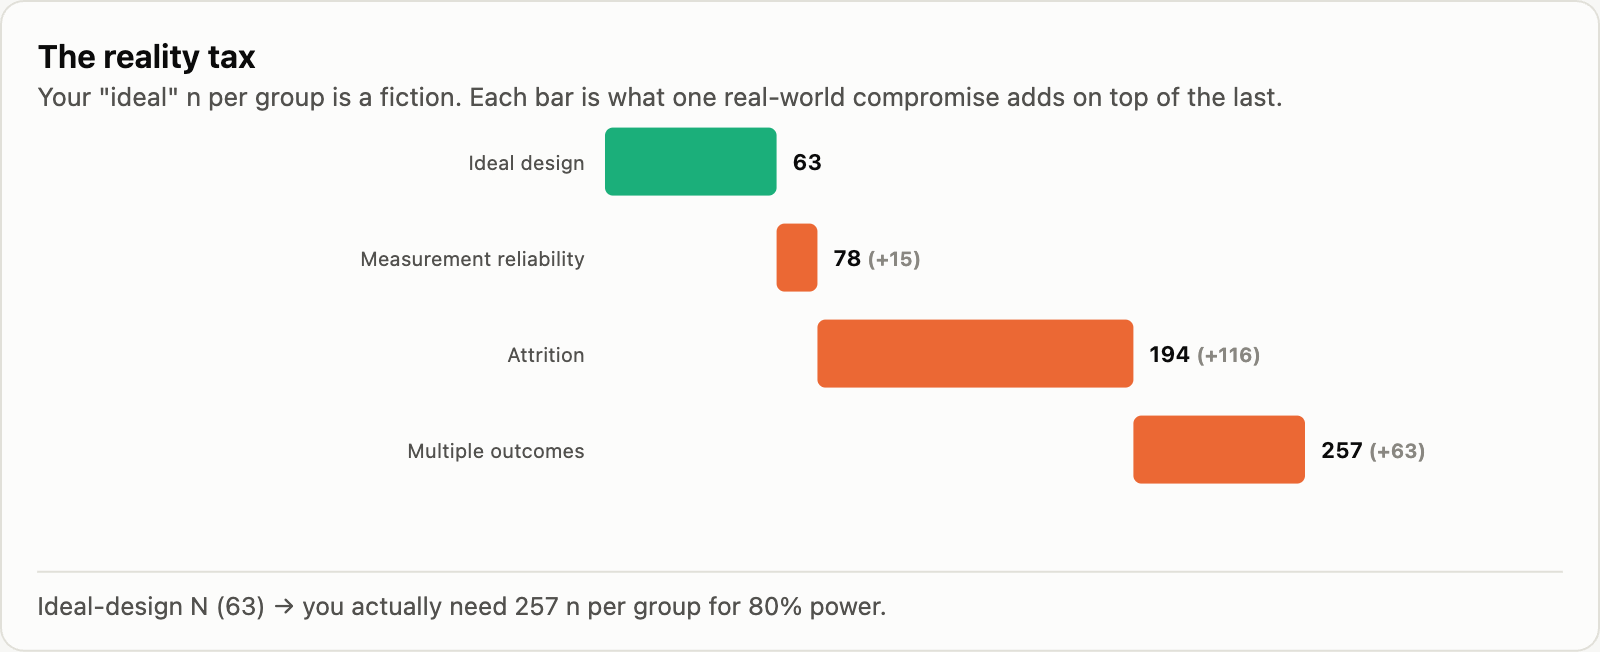
  • Studies run underpowered, then the significant results that do turn up get overstatedMonte Carlo power analysis shows the true sample size before a single data point is collected
  • Data collection instruments and cleaning pipelines built ad hoc for every studyReusable, privacy-aware data pipelines built around your study design
  • Funders and policymakers need a plain-language read, analysts need full rigourOne dashboard, two reading modes — analyst view and plain-language brief
Try BEDROCK demo → Try KEYSTONE demo →

Insight-driven. Pressure-tested.

Data-driven decisions aren't a luxury — they're a competitive necessity. Our expertise was built at the world's highest-stakes events, and we bring that same analytical discipline to every client and every research collaborator we work with.

London 2012 Olympic medals
On the dugout at Cologne Stadium, Euro 2024
On the dugout at Cologne Stadium, UEFA Euro 2024
Team TF Bus System, London 2012
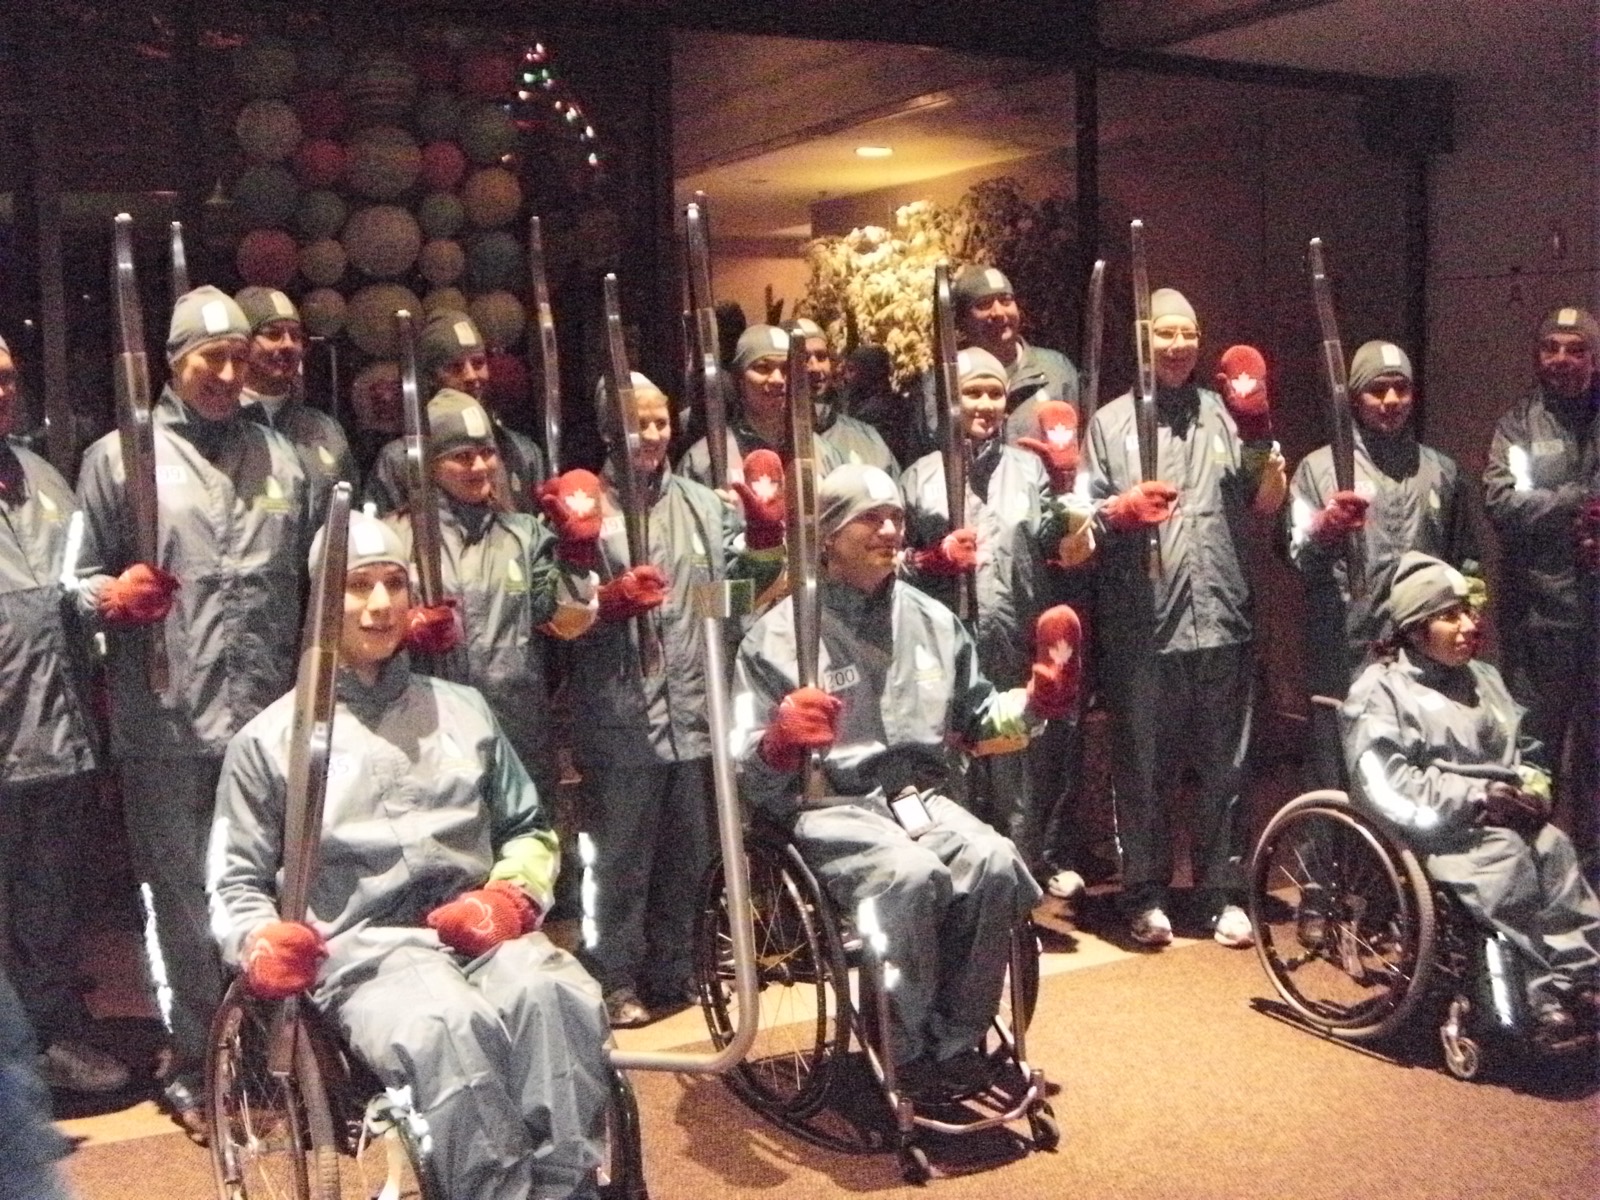
Torchbearers, Vancouver 2010 Olympic Winter Games
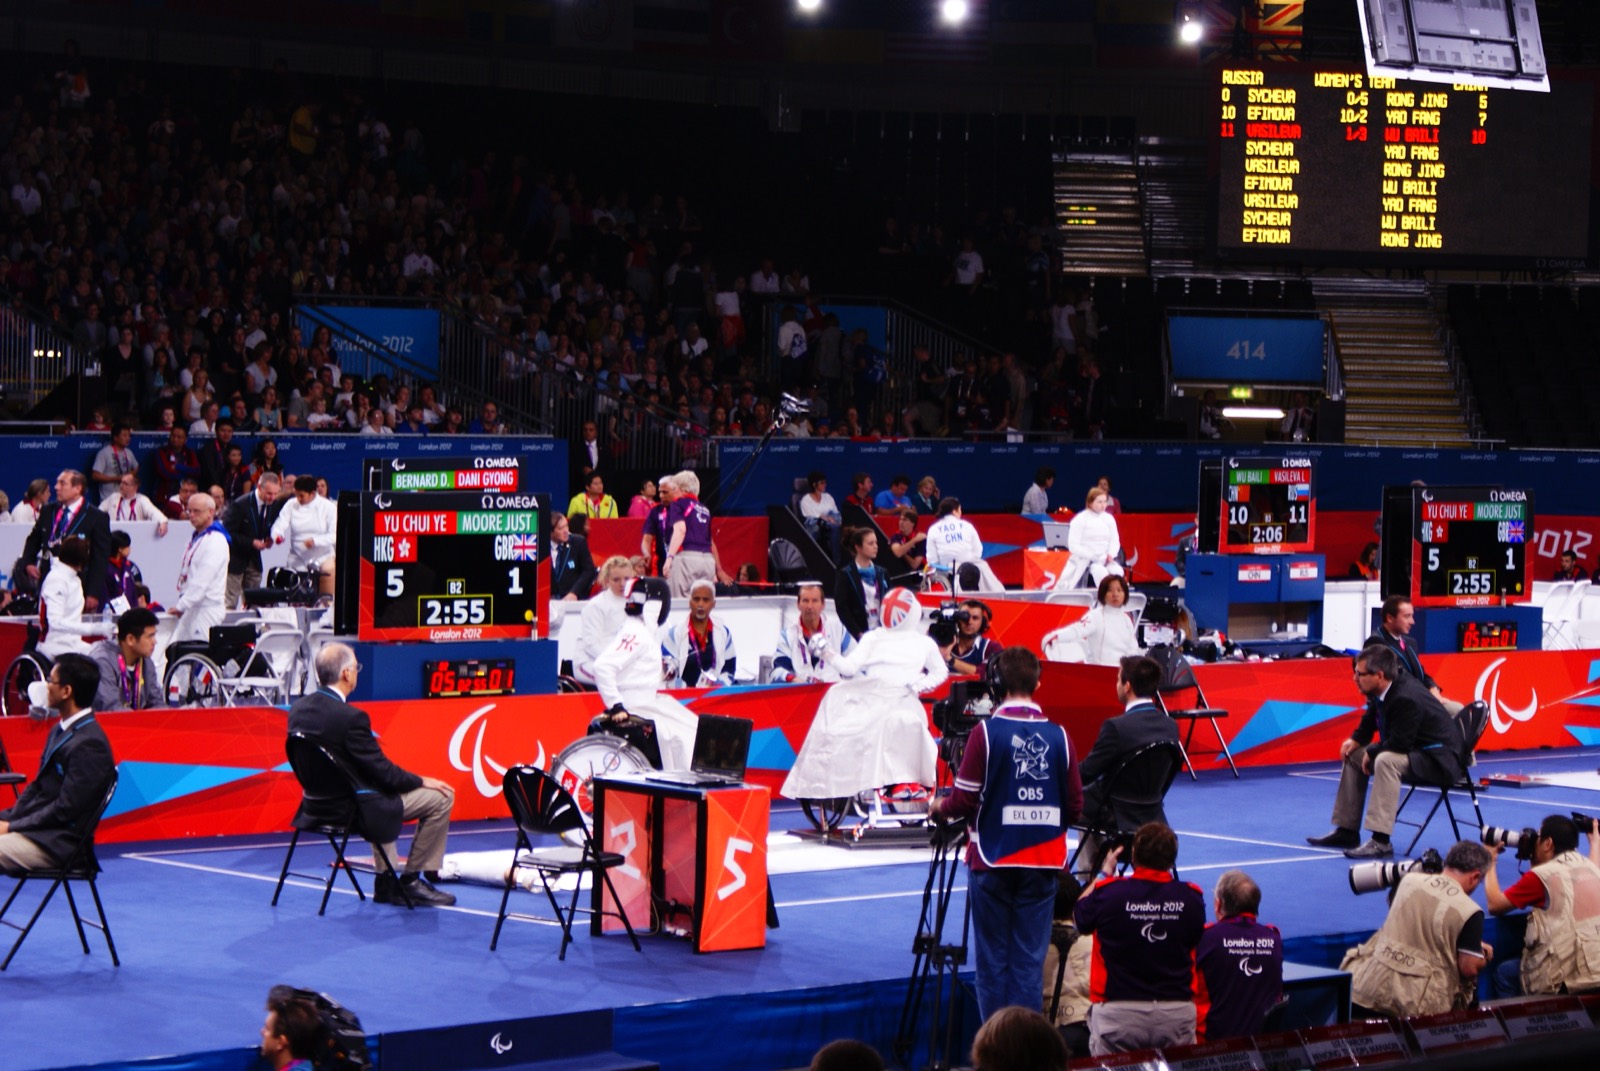
Wheelchair Fencing, London 2012 Paralympic Games
ITU Test Event, Paris 2024
ITU Test Event — Paris 2024

/N3U specialises in data analytics, research collaboration, and workflow automation — the kind that eliminates guesswork, surfaces what actually matters, and gives your team the space to act on it instead of being buried in it.

That expertise was forged at major international events where decisions had to be data-driven and there was no room for a broken spreadsheet on game day. That same standard now serves academic, operational, funding, and industrial research teams — and every ambitious business that's ready to operate with the same clarity.

Clarity over complexity

We simplify the intimidating. Every recommendation is explainable.

Data before assumption

Every recommendation is grounded in what your data actually shows — not gut feel or convention.

Speed with craft

We move fast without cutting corners. Quality is non-negotiable.

Genuine partnership

We treat every client as a long-term relationship, not a transaction.

When your data works, your team can focus on what matters.

From the field to the dashboard

Why /N3U exists — a story of frustration, persistence, and a decision to finally build the tool that should have existed all along.

Richmond Olympic Oval, Vancouver 2010
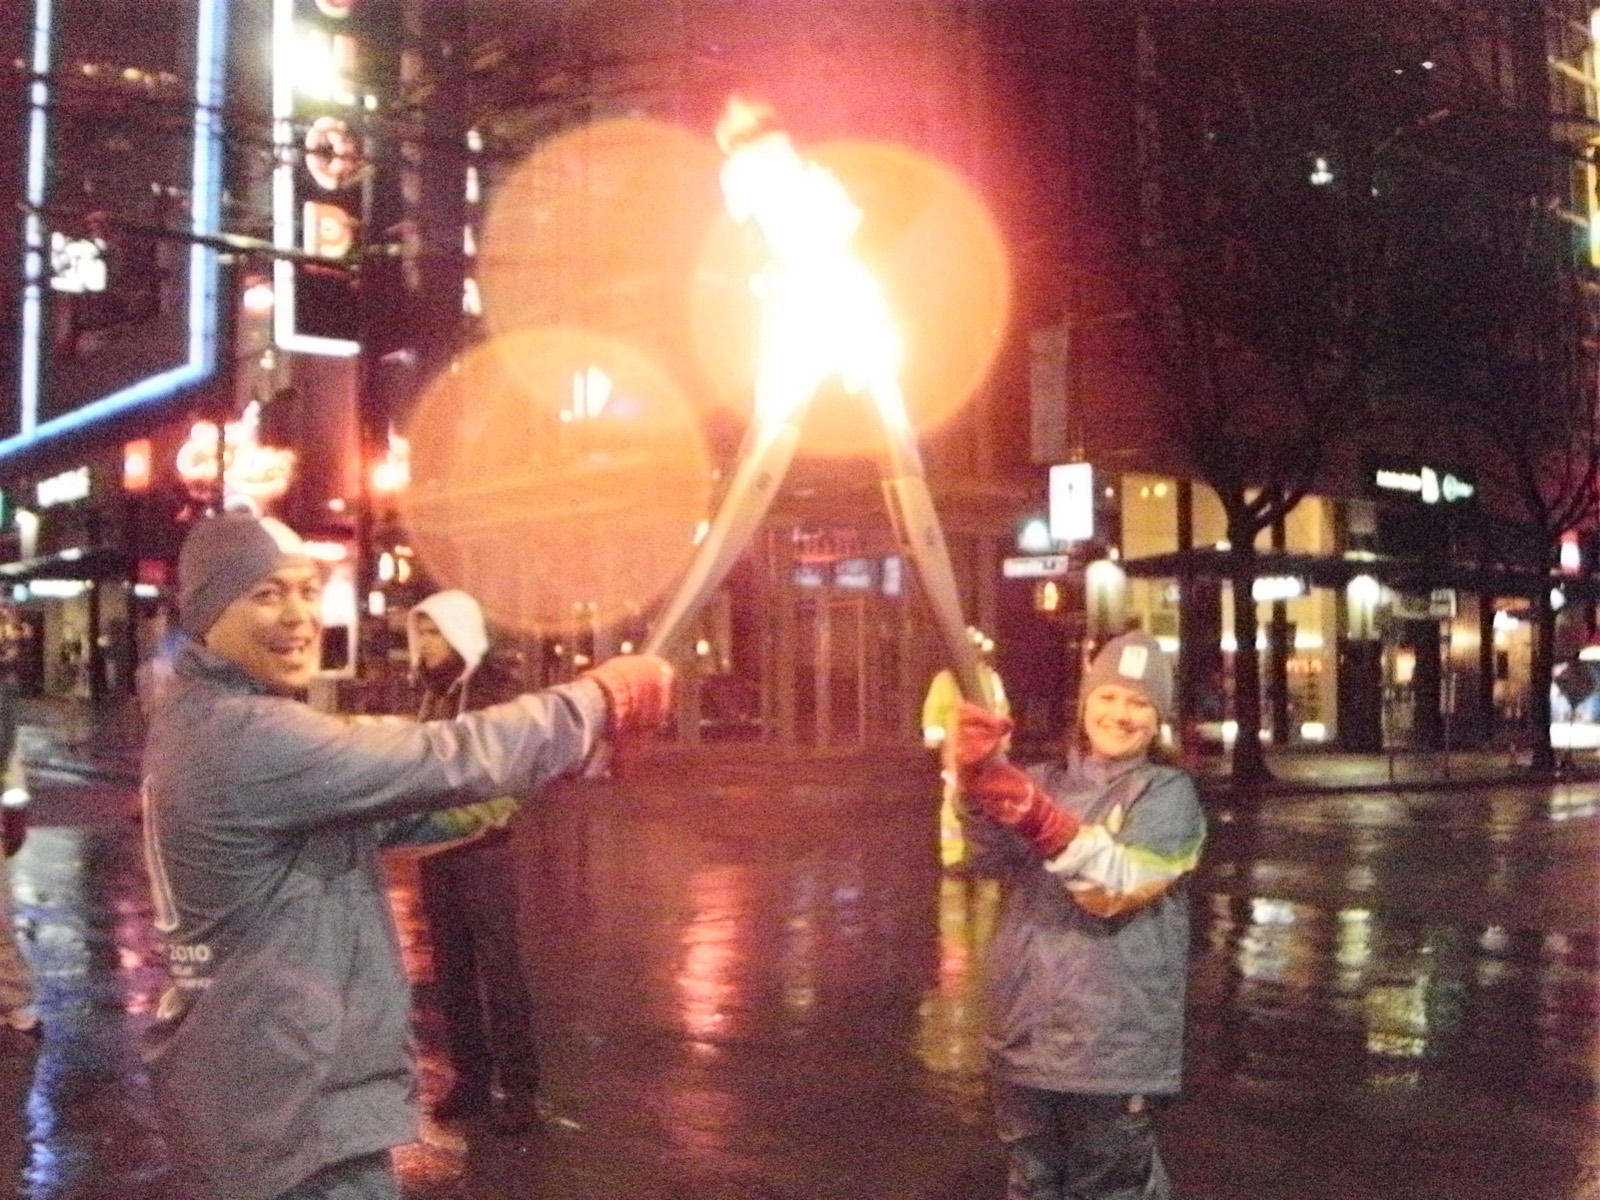
Olympic torch relay, Vancouver 2010
A lifelong dream realized — carrying the Olympic flame as a torchbearer through the streets of Vancouver, 2010.
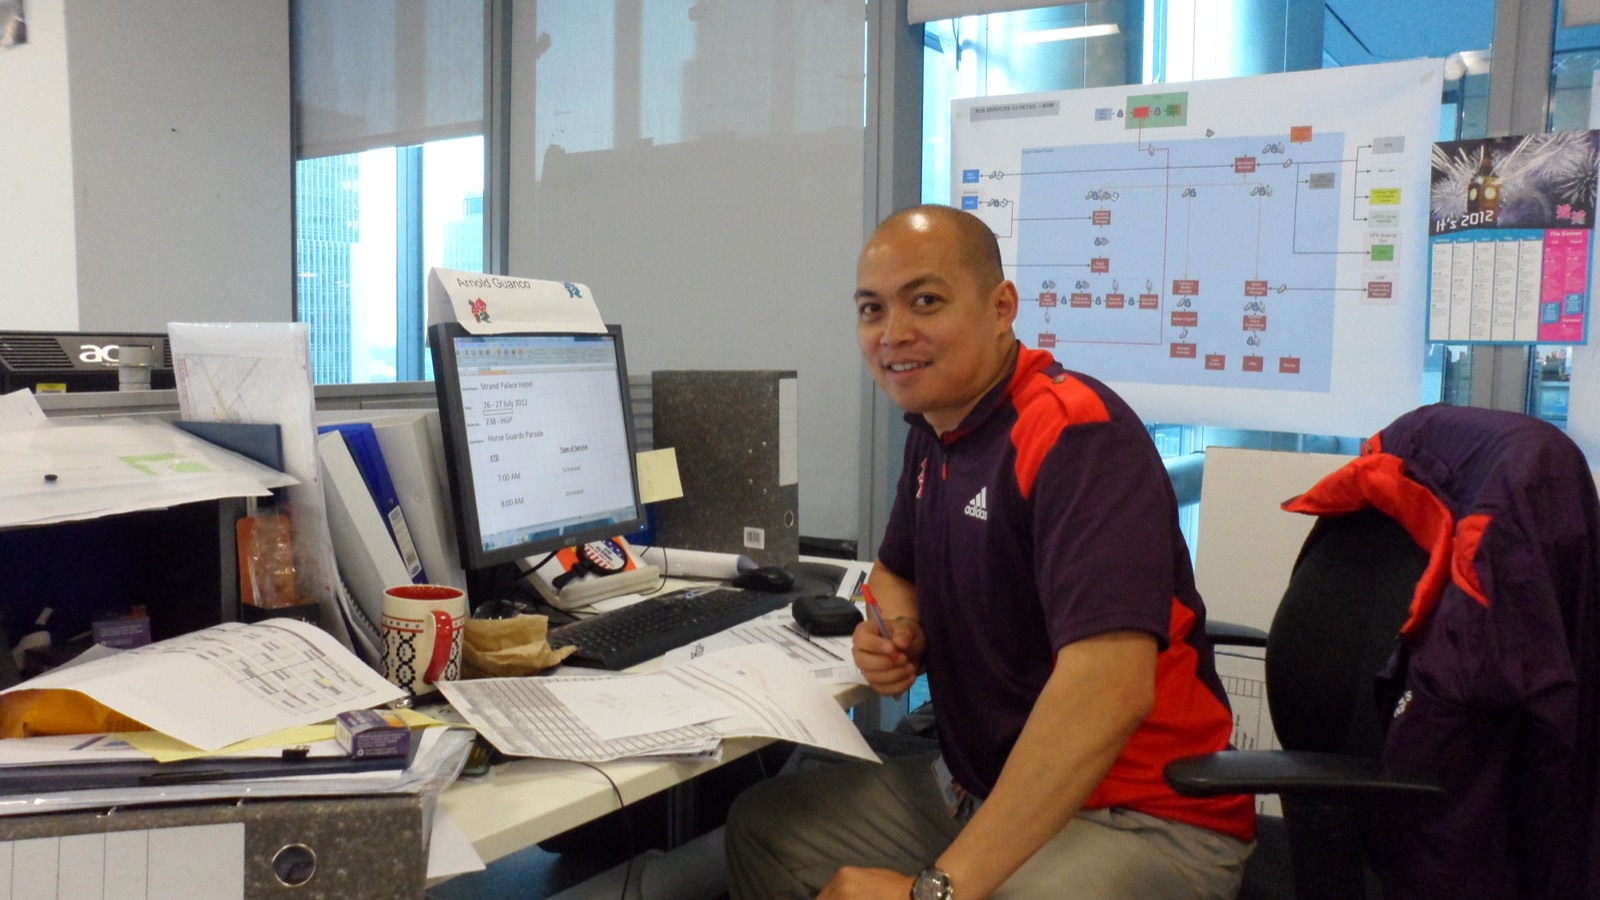
Operations desk, London 2012
Running the operations desk, London 2012.
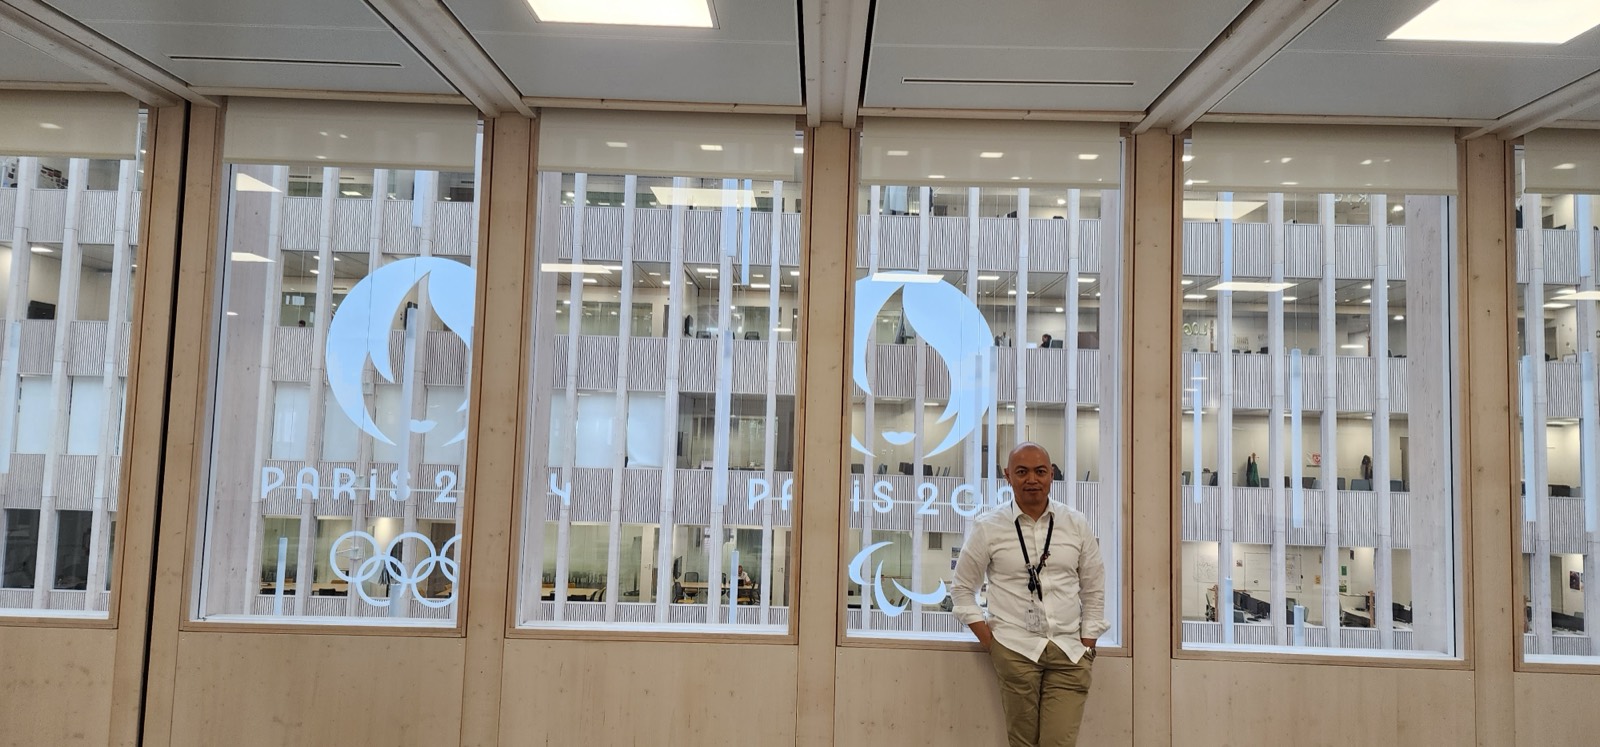
Paris 2024 headquarters

My interest in data analytics and AI automation didn't start in a classroom — it started on-site, at major international sporting events, where the same frustrations kept resurfacing project after project. There was never an efficient system to manage the dozens of moving resources an event of that scale demands.

Transportation was the worst offender. Tracking vehicle inventory, matching the right drivers to the right routes based on their training, keeping headcounts accurate for the day — it was less a workflow and more a daily gamble.

On one event, syncing vehicle requirements, route assignments, and driver musters required three separate programs running at once. Something broke almost every time. It wasn't a process — it was a constant fight against the tools meant to support it.

That instinct to find the root cause, not just patch the symptom, is the same one that's always pulled me toward research. Long before /N3U existed, I was the person reading the paper, not just the abstract — trying to understand why a finding held up, or didn't, rather than taking the headline at face value. That habit of digging into the evidence is what eventually turned into a genuine specialty: helping researchers pressure-test their own findings with the same rigour I once wished someone had brought to the field.

"A day or two before the event went live, we'd discover the master sheet — the one thing everything depended on — simply didn't work."

The breaking point

Spreadsheets built to sync route timings, drivers, and vehicles into one master file — only to fail right before kickoff.

The dream

A single dashboard that turns operational chaos into insight — built for data-driven decisions, not after-the-fact damage control.

The turning point

Countless nights spent learning how AI could finally close the gap — turning years of frustration into the determination to build it myself.

That determination is /N3U. I now build the automated workflows and operational dashboards I once searched for and couldn't find — starting with major international events where the stakes are highest, extending that same standard to every SMB that deserves to operate at that level, and putting that same love of digging into the evidence to work for researchers who need to know whether a finding actually holds.

From first call to running system — three steps

No long procurement cycle, no guessing what you're signing up for. Here's exactly what happens after you reach out — research engagements start the same way, with a conversation about the question you're trying to answer.

01

Free workflow audit

A short call and a look at how your team works today. We tell you plainly what's worth automating and what isn't — no cost, no obligation.

02

Build & deploy

We design, build, and test the system, then hand it over with training — so your team can run it without needing us in the room.

03

Ongoing support

Fixes, improvements, and monthly check-ins to keep the system evolving with your business — priced as a simple retainer, not surprise invoices.

Book a free workflow audit

Ready to make data work for you?

Tell us what's eating up your team's time — we'll show you what the data says to automate first, so your people can focus on the decisions that actually move the needle.

N3U business card
N3U business card

Prefer email or a call?

Reach us directly and we'll get back to you within a business day.

[email protected]
+1 672 272 8267 (WhatsApp)

Where we work

Philippines, Canada, and globally — remote-first, timezone-flexible.